
Tesla charging cost tracker
Tesla charging cost tracker: cost by session, location and tariff
A useful charging cost tracker keeps the charging session, energy, location and price basis together. That makes it easier to understand home charging, Supercharging, public charging and the monthly total without turning everything into one unexplained average.
What a charging cost tracker should show
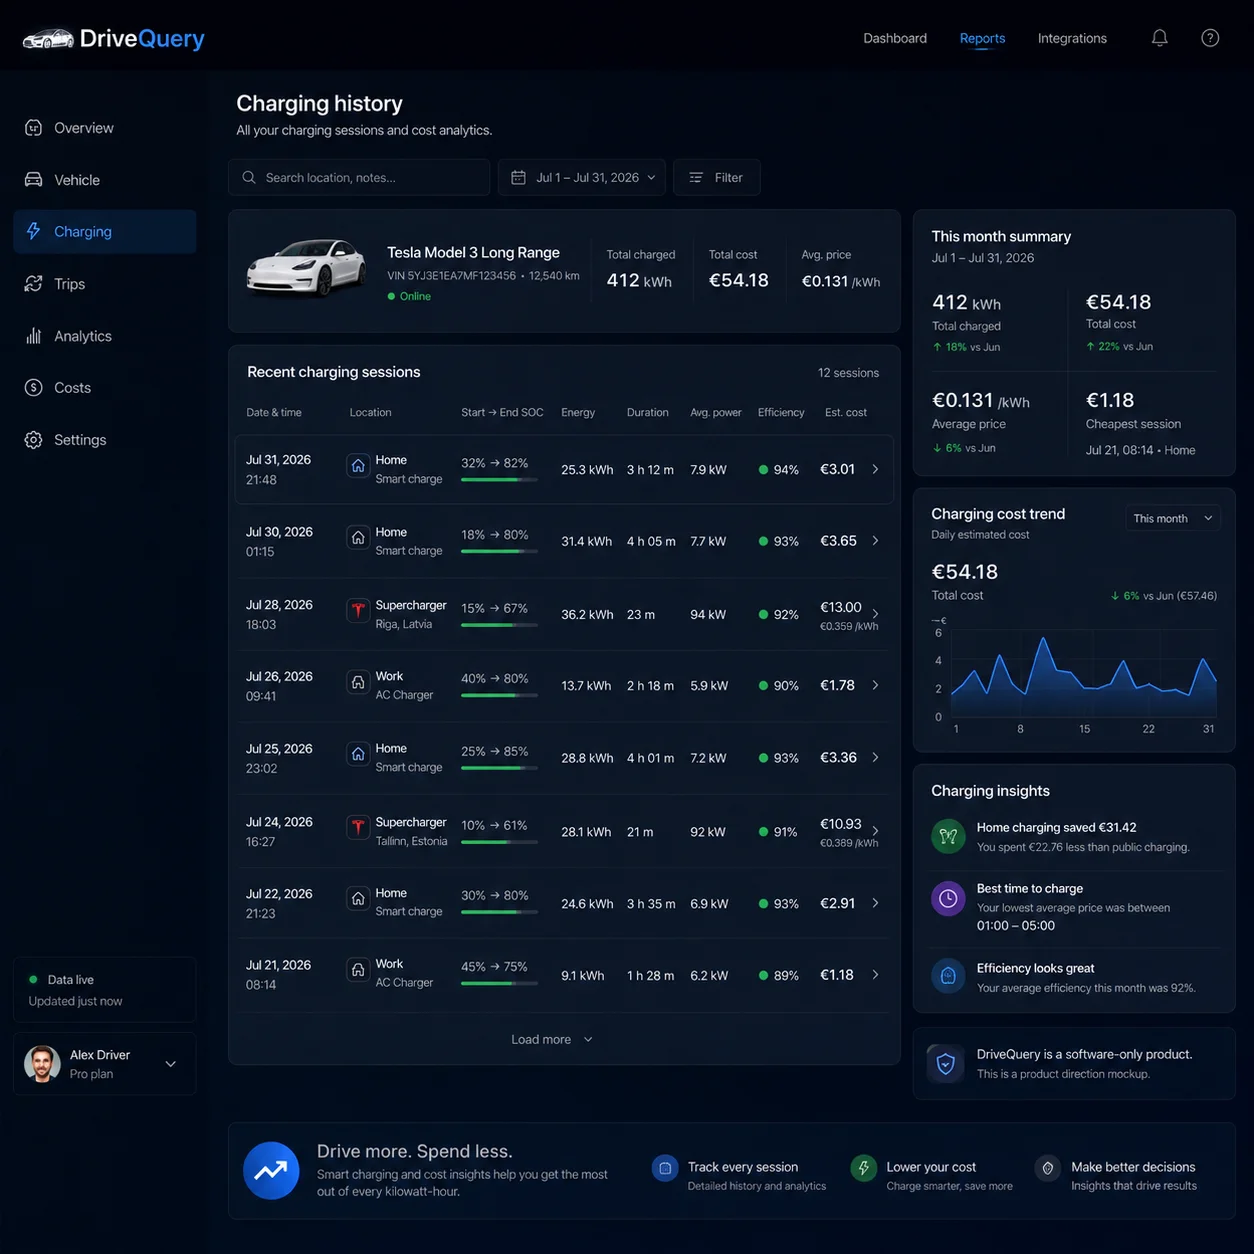
Start with the session
Keep the energy and charging time for each event instead of jumping straight to a monthly average.
Keep the price basis
Show whether the number came from a flat tariff, off-peak rate, dynamic price, invoice or another assumption.
Separate locations
Home, work, Supercharging and other public charging can all have different costs and evidence.
Roll up without hiding detail
Build weekly and monthly totals while keeping the individual sessions underneath them.
What should a Tesla charging cost tracker actually track?
The headline number is simple: how much did charging cost? The hard part is making that number explainable. A Tesla can be charged at home overnight, at home during an expensive peak period, at work, at a Supercharger and at third-party public chargers in the same week. Those sessions can use completely different price rules.
A good tracker therefore does not begin with one average price per kWh. It begins with the charging event and keeps enough context to calculate or verify the cost later.
| Field | Why it matters |
|---|---|
| Date and time | Determines the correct tariff period and makes the event easy to find later. |
| Energy charged | Provides the kWh basis for energy-based pricing. |
| Charging location | Separates home, work, Supercharger and other public charging. |
| Price basis | Explains whether the amount used a flat rate, time-of-use rate, dynamic market price or billed session price. |
| Estimated cost | Gives a usable cost where a final invoice is not available. |
| Billed cost or fees | Lets a real Supercharger or public-network charge override an estimate when available. |
| Period total | Turns detailed history into weekly, monthly or custom-range reporting. |
DriveQuery is being designed around this structure: keep the charging event first, then attach the relevant cost context. That is more useful than a number that looks precise but cannot be traced back to the session that produced it.
Tesla already has Charge Stats — where does a separate tracker help?
Tesla's Charge Stats is already useful. Tesla says the graph can show Total Charged or Total Spent, and charging is colour-coded by location type. Home rates can be configured, including time-of-use periods, while Work and Other locations can use configured or estimated rates.
That answers the broad question well: roughly how much energy and money went into charging over a selected period? A separate tracker becomes useful when you want to keep the underlying sessions, price assumptions and billing evidence together for longer-term analysis or reporting.
- Session-level traceability. Tesla states that charging in Charge Stats is aggregated by charging-location type for each day. A session ledger keeps individual events separate.
- Mixed evidence. Home charging may be an estimate from your electricity tariff while a Supercharger session has a final Tesla invoice.
- Dynamic tariffs. The relevant price can change by hour or quarter-hour, so the charging timestamp matters.
- Custom reporting. A tracker can build month, quarter or employer-reporting periods from the same underlying history.
If a charging network gives you a final billed amount, keep that billed amount. Use tariff-based calculations where the session itself is not separately invoiced.
How charging cost is calculated session by session
For a straightforward energy tariff, the basic calculation is:
Example: 36.8 kWh × £0.08/kWh = £2.94.
The important phrase is applicable price. A charge that began at 01:15 on an off-peak tariff may have a different cost from an otherwise identical charge at 18:15. On a dynamic tariff, one long charging session may even span several price intervals.
For that reason, a tracker should retain the time and price context rather than store only the final amount. If the electricity tariff changes later, old sessions should still show the basis that was used at the time.
Flat, time-of-use and dynamic tariffs need different logic
Flat tariff
The simplest case. Multiply the relevant kWh by one price, while still keeping standing charges or other household costs separate unless your accounting method explicitly includes them.
Time-of-use tariff
Cheap and expensive periods are predefined. The tracker needs to know when the charging happened, not just how many kWh were added.
Dynamic tariff
The energy price changes with the market. Matching consumption to the correct hour or quarter-hour is more accurate than applying the day's average price.
Solar or home battery
Calling solar energy “free” may be convenient, but the economic cost can depend on lost export revenue, battery use and your own accounting method. Keep the assumption visible.
If your goal is not only to track the price but actively move charging into cheaper periods, see the Tesla dynamic-tariff charging guide and smart charging guide.
Home charging: estimate the bill, but label the measurement point
Home charging is where a tracker can add the most context — and where false precision is easiest to create. The car's charging data and the household electricity meter do not necessarily measure the same point in the system.
- Vehicle-side energy describes energy recorded by or delivered to the vehicle.
- Wallbox or electricity-meter energy describes energy drawn further upstream and can include charging losses.
AC/DC conversion, battery conditioning and other systems can consume energy while the car is plugged in. So a vehicle-based cost calculation can be very useful for ownership tracking without being identical to the supplier invoice.
If you have a Tesla Wall Connector, Tesla says the app can show up to 12 months of charging history with individual sessions, including duration and energy delivered. That is another useful source for home-charging reconciliation. See Tesla's Wall Connector app documentation.
For employer reimbursement, tax evidence or accounting, use the measurement and documentation required by the relevant policy. A vehicle-data tracker should not pretend to be a certified electricity meter.
Supercharging: keep the actual Tesla transaction
Supercharging is different from home charging because there is normally a final transaction. Tesla lets owners view charging history and invoices in the Tesla app. Tesla also notes that Supercharger pricing can depend on site and time, and session details can include non-energy charges such as congestion fees where applicable.
That means the strongest monthly record is usually the actual billed Supercharger amount, not a reconstructed estimate such as “Supercharger kWh × average network rate”. A tracker can still keep the kWh and location beside the final amount so the session remains comparable with home charging.
See Tesla's Supercharging support for current billing and history details.
Third-party public charging needs a fallback hierarchy
Public charging outside Tesla can be messy. Networks can bill by kWh, by minute, with a connection fee, through a membership plan or with roaming mark-ups. The amount first shown by the charger may not even be the final settled amount.
A practical tracker can use a simple hierarchy:
- Final invoice or receipt when available.
- Known session tariff if the final billed amount is unavailable.
- Estimated tariff only when nothing stronger exists — and clearly label it as an estimate.
This preserves a single charging history without pretending all sources have the same accuracy.
A real example: one week, four different price bases
Consider an illustrative week. The rates below are examples, not current market prices.
| Charge | Energy | Price basis | Cost |
|---|---|---|---|
| Home, Monday night | 31.4 kWh | £0.08/kWh off-peak | £2.51 |
| Home, Thursday evening | 18.2 kWh | £0.29/kWh peak | £5.28 |
| Supercharger, Saturday | 42.6 kWh | Final Tesla transaction | £19.30 |
| Public charger, Sunday | 16.8 kWh | Receipt including session fee | £11.10 |
| Week | 109.0 kWh | Mixed | £38.19 |
A single average rate would give you the £38.19 headline, but it would hide the useful part: only 17% of the week's energy was taken at the expensive public charger, yet that session represented almost 30% of the spend. That is the kind of pattern a cost tracker should make obvious.
What should the dashboard show at a glance?
- Total kWh and total cost for the selected period.
- Average cost per kWh, without hiding the distribution behind it.
- Home / work / Supercharger / other split.
- Estimated vs. billed amounts so different evidence is not mixed silently.
- Individual sessions with date, duration, kWh, location and price basis.
- Trend by week or month to spot behavioural or tariff changes.
- High-cost outliers so one unusual session does not disappear into a monthly average.
If you mainly want the headline monthly figure, see Tesla charging cost per month. The tracker is the deeper view that explains how that number was built.
How a tracker helps answer “why did charging cost more?”
Cost can rise even when you drove roughly the same distance. A useful tracker lets you test the likely causes quickly:
- Did total kWh rise? More driving, preconditioning or charging losses may simply mean more energy.
- Did the location mix change? A road trip can shift energy from cheap home charging to expensive public charging.
- Did charging move into expensive hours? This matters on time-of-use and dynamic tariffs.
- Did the configured home rate change? A corrected tariff can move the estimate without changing behaviour.
- Were there extra fees? Public charging can include charges that are not visible in kWh alone.
- Are you comparing different measurement points? Wall energy and vehicle energy can differ.
When the session detail stays attached to the monthly total, those questions take minutes instead of spreadsheet archaeology.
Charging cost is more useful when paired with driving data
£60 of charging does not tell you whether the car was cheap or expensive to run unless you know how far it travelled. Pairing the same period of charging data with Tesla trip history makes it possible to calculate an energy cost per mile or kilometre.
That still is not the total cost of ownership — insurance, tyres, depreciation and finance are separate — but it is a much better operational metric than charging spend alone.
What DriveQuery is being built to do
DriveQuery's charging cost tracker is being designed to keep the source data visible rather than replace it with a black-box number. The intended flow is simple:
- Detect and record the charging session.
- Keep the energy, time and location context.
- Apply the most relevant price basis available.
- Keep billed and estimated amounts distinguishable.
- Roll sessions into weekly, monthly and custom-period totals.
- Let you open the total back into the sessions that created it.
The same history can then support budgeting, charging-history export, employer reporting and smarter charging decisions without maintaining a separate spreadsheet for each reporting need.
Frequently asked questions
Does the Tesla app already track charging cost?
Yes. Tesla Charge Stats can show energy charged and estimated spend, grouped by charging-location type. A separate tracker is useful when you want session-level history, mixed price sources, longer-term reporting or a traceable calculation behind period totals.
Can a charging cost tracker show the exact electricity bill cost?
Not always. If the calculation uses vehicle-side kWh and a tariff, it is an estimate. Your electricity meter may record more energy because of charging losses and other loads. For invoice-level evidence, use the appropriate meter, bill or certified charging data.
How should dynamic electricity prices be handled?
Match charging energy to the price interval that applied when it was consumed. On markets with hourly or quarter-hourly prices, using one daily average can materially distort the cost of a long charging session.
Should Supercharging be estimated from kWh?
Use the final Tesla transaction or invoice when available. That captures the actual session price and any applicable non-energy fees better than a generic average rate.
What is the difference between a charging cost tracker and monthly charging cost?
The monthly cost is a summary. A tracker keeps the individual sessions, locations and price bases that produce that summary, so you can audit changes and build other reporting periods.
Why does the car's kWh differ from my wallbox or electricity meter?
They can measure different points in the charging chain. Conversion losses, battery conditioning and other vehicle systems can consume energy between the wall and battery.
Can I separate home and work charging?
Yes, when the charging location can be identified reliably. Keeping location beside the session is useful because home, work and public charging often use different price and reimbursement rules.
Can DriveQuery replace my electricity supplier or charging-network invoice?
No. DriveQuery can organise vehicle charging events and cost estimates, but invoices and certified meters remain the stronger source where exact billing or formal reimbursement evidence is required.
Related DriveQuery pages
Need an estimate before you have charging history? Start with the Tesla charging cost calculator.
Know what the total is made of.
Join the waitlist for a Tesla charging cost tracker that keeps every session, kWh and price assumption within reach.